
Your podcast has listeners. Your CMO wants to know if those listeners are the right listeners and whether any of them are contributing to pipeline growth.
Fair question. And if your podcast measurement strategy starts and ends with download counts, you probably don’t have a great answer.
Here’s the thing: Downloads tell you almost nothing about whether your podcast is reaching decision-makers at your target accounts. A podcast with 500 downloads per episode that’s reaching VPs of Marketing at mid-market SaaS companies is worth more than one pulling 10,000 downloads from an audience that will never buy from you.
So how do we find out whether we are reaching the right audience and if they’re actively engaged? Don’t worry. We won’t leave you hanging.
This post breaks down how B2B brands are actually measuring podcast performance in 2026. Yes, we’ll go far beyond downloads and into the metrics that prove business impact and make reporting easy.
TL;DR: The B2B podcast measurement cheat sheet
Stop measuring:
- Download numbers in isolation
- Vanity subscriber counts
- Social shares as a proxy for impact
Start measuring:
- Who’s listening: Company names, job titles, seniority levels, industries
- ICP match rate: What share of your downloads comes from companies that fit your ideal customer profile?
- Pipeline influence: Are listener companies showing up in your CRM?
- Content engagement: Completion rates, drop-off points, episode-over-episode trends
- Attribution: Which channels, guests, and topics drive the highest-quality listeners?
- Campaign reach: When you spend to grow the audience, did the new listeners match your ICP?
The bottom line: B2B podcast measurement is about connecting listener data to revenue outcomes. The tools do exist right now. Most brands just aren’t using them yet.
Why downloads don’t cut it for B2B podcasts
If you’re a B2C brand, downloads are actually a reasonable top-line metric. More listeners generally means more potential customers, and the math is simple. Also, many B2C brands are going for a broader reach and have a goal of large-scale brand awareness.
B2B is different. You’re not selling to everyone. You’re selling to a specific type of buyer at a specific type of company. A thousand downloads from college students doesn’t move the needle if you sell enterprise security software. I also recently recorded a YouTube video breaking down what B2B brands should be tracking instead of podcast downloads.
The metrics that matter in B2B podcast measurement fall into four categories:
| Category | What to Measure | Why It Matters | How to Get It |
|---|---|---|---|
| Audience Quality | Company names, industries, job roles, and seniority | Proves you're reaching decision-makers, not just filling a feed | CoHost B2B Analytics |
| Engagement Depth | Completion rates, avg. listen time, and drop-off points | Shows whether content resonates or isn’t of value to audiences | Apple/Spotify via CoHost Consumption Data |
| Business Impact | Listener-to-lead conversion, pipeline influence, and deal velocity | Connects podcast activity to revenue | Salesforce Integration + CRM matching |
| Listener Growth | New listener growth data and unique listener dashboards | Tells you how much your audience is growing and retaining | New Listener Metric by CoHost + Unique Listener metrics |
Using B2B analytics to identify your real audience
Most podcast analytics tools tell you how many people are listening. CoHost’s B2B Analytics tells you who they are at the company and job role level.
That means you can see:
- Company names of organizations tuning in
- Company size (employee count and revenue brackets)
- Industry classification of listener companies
- Job roles and seniority levels of your audience
- Episodes listened to by the company/job role
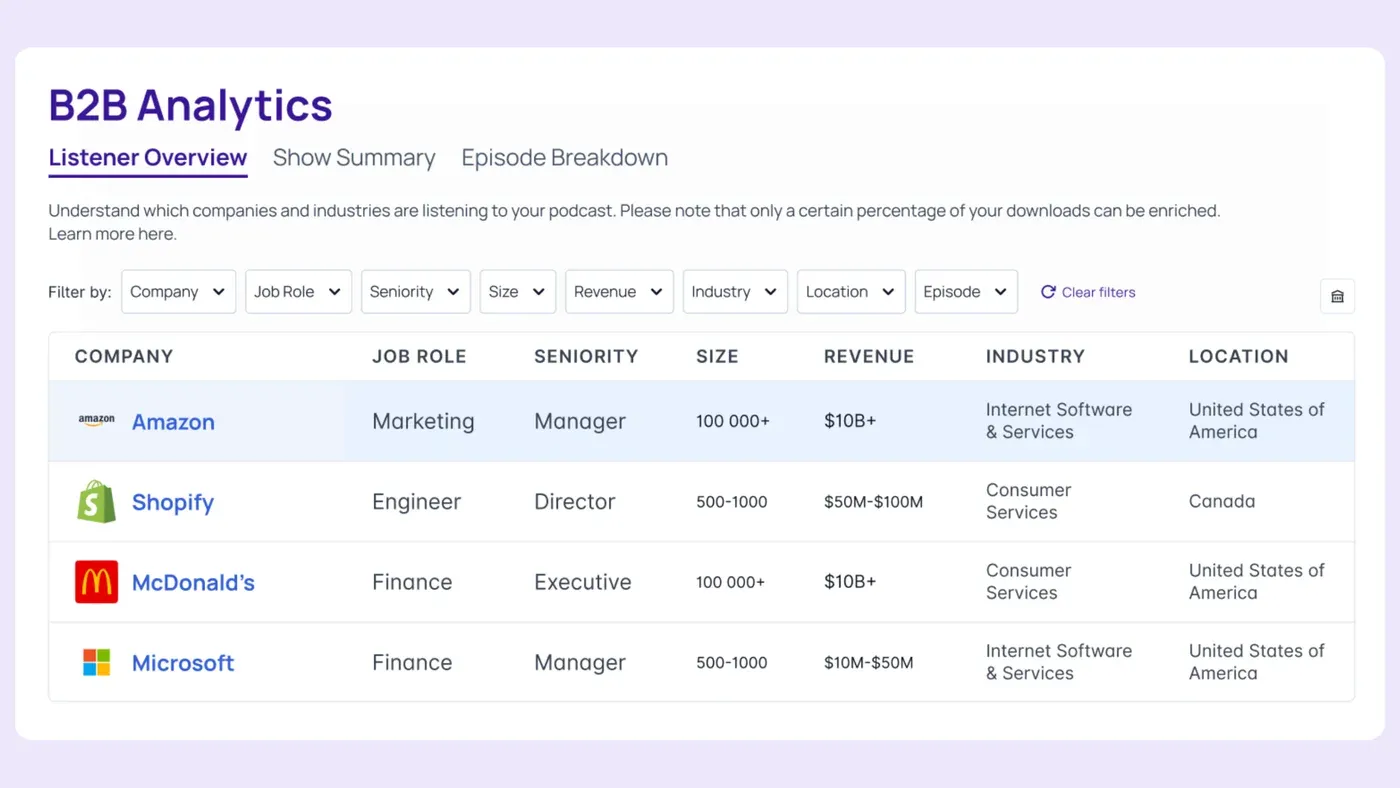
That level of detail changes what you can say about the show. Instead of reporting how many people listened, you report which companies did.
Let’s walk through three use cases together:
Use case 1: ICP validation
You launched your podcast to reach senior marketers at mid-market fintech companies. Six months in, B2B Analytics shows that 60% of your listeners are actually junior marketers from larger financial institutions.
This doesn’t mean your podcast isn’t good or a failure; it’s a signal that you can work with. Either your content is resonating with an adjacent market you should pursue, or your content needs adjustment to align more with those senior marketers at mid-market fintech companies.
Without company-level data, you’d never know who you’re actually reaching.
As a real-life example, Procore used CoHost to tie podcast performance directly to their business KPIs, using podcast analytics to validate that their construction technology audience was actually listening, not just measuring downloads or other vanity metrics.
Use case 2: Sales-ready lead intelligence
Let’s say your B2B Analytics dashboard shows that three enterprise accounts your sales team has been trying to break into are regularly listening to your podcast. That’s warm intent data.
Export that listener company data (or automatically sync this data with Salesforce) and share it with your sales team. Instead of a cold outreach, your BD team can open with:
- The episode topic they were listening to
- Suggesting another relevant episode
- Inviting them on as guests (if relevant)
That’s a fundamentally different conversation than a cold email… and likely a more successful one.
Pro tip: Set up a monthly cadence for exporting listener company data to your sales team. Pair it with gated content in your show notes, like a worksheet, template, or report that requires an email to access. Now you’ve got a name attached to a company.
Use case 3: ROI justification
Your CMO asks the question that makes us sweat a little: “Is the podcast working?”
But sweat no more, with B2B Analytics, you can answer the ROI question with specifics:
- “In Q1, 62% of listener companies matched our ICP.”
- “12 of our target accounts appeared in the listener data.”
- “3 of our target accounts that listened to the podcast entered our pipeline during the same quarter, representing $340K in potential ARR.”
With responses like that? I’d definitely be continuing the podcast.
Connecting podcast data to your CRM with Salesforce Integrations
This is where B2B podcast measurement gets serious.
CoHost’s Salesforce Integration lets you match podcast listener data against your CRM records automatically. Instead of manually exporting spreadsheets, the listener company data flows into Salesforce, where your revenue team already works.
What that gives you:
- Pipeline influence reporting: See which open opportunities are at companies that listen to your podcast.
- Account-based intelligence: Know which target accounts are engaging with your content before they ever fill out a form.
- Multi-touch attribution: Add “podcast listener” as a touchpoint in your buyer’s journey alongside webinars, content downloads, and events.
- Closed-won analysis: After a deal closes, look back and see if the account was in your listener data. Over time, this builds the case that podcast listeners convert at a higher rate.
Watch a full feature walkthrough of CoHost’s Salesforce Integration.

Beyond audience data: Other metrics that drive decisions
B2B Analytics and other audience demographics aren’t the only measurement levers. Here’s what else to track:
Campaign reach: Did your growth spend land on the right companies
Most podcast growth reporting stops at the number of new downloads a campaign produced. For a B2B brand that number is close to meaningless on its own. A campaign that adds 3,000 downloads from people who will never buy from you is not a win, it is a more expensive version of the same problem downloads already had.
The measurement question is narrower: did the campaign reach companies that match your ICP?
That is the number to hold audience growth work to, whether you run campaigns yourself or use a managed service. Run the campaign, then check the listener data for the period against your ICP criteria. You are looking for three things:
- New listener companies, not just new listeners. Which organizations appeared in the data that were not there before the campaign?
- ICP match rate on the new cohort, measured separately from your baseline audience. A campaign can lift total downloads while pulling your match rate down.
- Whether the new companies stayed. A spike that does not survive the next three episodes bought attention, not audience.
Pair that with the New Listener Metric so you can see the campaign’s new listeners separately from your returning ones. Without that split, a campaign and a strong episode look identical in the chart.
Channel attribution with Tracking Links
You’re promoting your podcast across LinkedIn, email, your website, guests, and paid channels. Which ones are actually driving listeners?
Tracking Links lets you create unique URLs for each episode and promotion channel so you can see exactly where your audience comes from.
Run different links for:
- Social media posts (LinkedIn, X, Meta)
- Paid ads (Social, Google, YouTube)
- Direct email marketing
- Newsletters
- Podcast guest promotion
- Website embedded players
- Episode show notes
- PR & Comms
- Internal communications
This isn’t just “nice to know” data. It directly informs where to spend your next marketing dollar.
Episode-level engagement
Not all episodes perform equally. Of course they don’t. But it’s on you and your team to pinpoint those differences and understand what your audience actually cares about.
Track engagement data like:
- Completion rates: Are listeners finishing episodes or dropping off at minute 12?
- Episode comparisons: Which topics, guests, or formats drive the highest engagement?
- Consumption trends: Is your audience growing, flat, or declining episode-over-episode?
Stories and Strategies used CoHost consumption data to increase their average listen-through rate from 50% to 80% by identifying exactly who listeners were, where they were dropping off, and restructuring episodes with these insights.
Listener growth and retention
Listener growth and retention are a balancing act. You, of course, want consistent growth in new listeners, but you also want to make sure you’re retaining existing, relevant listeners.
If all your listeners are new, that means you’re not retaining them. And that signals that your content isn’t resonating or you’re not landing with the right listener. On the flip side, if your entire audience is made up of existing listeners, that means you’ve plateaued and aren’t growing. Also bad.
So how do we measure this? These are the podcast analytics to look at:
- New Listener Metric: This metric, unique to CoHost, lets you measure the number of unique listeners that have tuned into your podcast for the very first time over a custom date range.
- Unique Listeners: Unique listeners tell you the number of individual listeners that have tuned into your podcast or episode. For example, if I were to listen to your podcast three times, that’d be three downloads but one unique listener.
Having this data makes it easier to:
- Measure audience growth: Understand how your listener base is truly growing.
- Uncover retention: Not a perfect science, but you can subtract new listeners over a period of time from your total unique listeners for the same timeline and get a rough estimate for listener retention.
- See what marketing campaigns perform: Use the New Listener Metric to spot trends or spikes in audience growth after campaigns have been launched.
Turn the metrics into one number you can defend
Everything above answers what to measure. At some point, usually in a budget review, someone asks a harder question: what is the podcast worth?
That question needs a single figure, and a single figure needs a method. Reporting six strong metrics to a CFO who asked for one number reads as an inability to answer. The Podcast ROI Framework walks the inputs above through a model that produces one number, and more importantly, shows how to defend it when finance pushes on the assumptions behind it.
If you want a fast estimate before doing the full exercise, the ROI Calculator will model the business impact from your own inputs.
Set up your B2B podcast measurement framework
If you’re starting from scratch or upgrading from “we check download counts sometimes” (and please do), here’s a practical four-week roadmap:
Week 1: Baseline
- Audit your current analytics setup: What are you tracking today? What are you missing?
- Migrate to CoHost (or add the Analytics Prefix to your existing host)
- Define your ICP criteria for listener matching (company size, industry, job titles)
Interested in switching to CoHost? Our team will migrate your entire podcast, along with your historical podcast data, from your current hosting platform to CoHost for free. Chat with our team to learn more.
Week 2: Instrumentation
- Create tracking links for every channel where you promote the podcast
- Set up gated content in your show notes for lead capture
- Connect Salesforce Integration if you use it as your CRM
Week 3: First Read
- Analyze your first B2B Analytics report: Who’s actually listening?
- Share listener company data with your sales team
- Review episode-level engagement (completion rates, drop-offs)
Week 4: Reporting Cadence
- Build a monthly podcast performance dashboard covering: audience quality, engagement, attribution, and pipeline influence
- Schedule a recurring share-out with your marketing leadership team
- Set benchmarks and targets for next quarter
Need help getting started? CoHost’s ROI Calculator can help you model the business impact before you invest, and our team is happy to walk you through the platform and chat about your data setup.
Start measuring podcast analytics that matter to B2B brands
Downloads are a starting point, not the finish line.
For B2B brands, the real value of podcast measurement is connecting audience data to business outcomes. This means proving that your podcast reaches the right companies, influences pipeline, and contributes to revenue.
CoHost gives you the tools to do exactly that: audience growth that puts the show in front of the companies you name, tracking links for channel attribution, B2B Analytics for company-level listener intelligence, Salesforce Integration for CRM-connected pipeline reporting, and new listener and unique listener data for audience growth measurement.
Ready to see your podcast data differently? Book a demo.